
Submarket 6
Low-Density Suburban, Mixed Prices
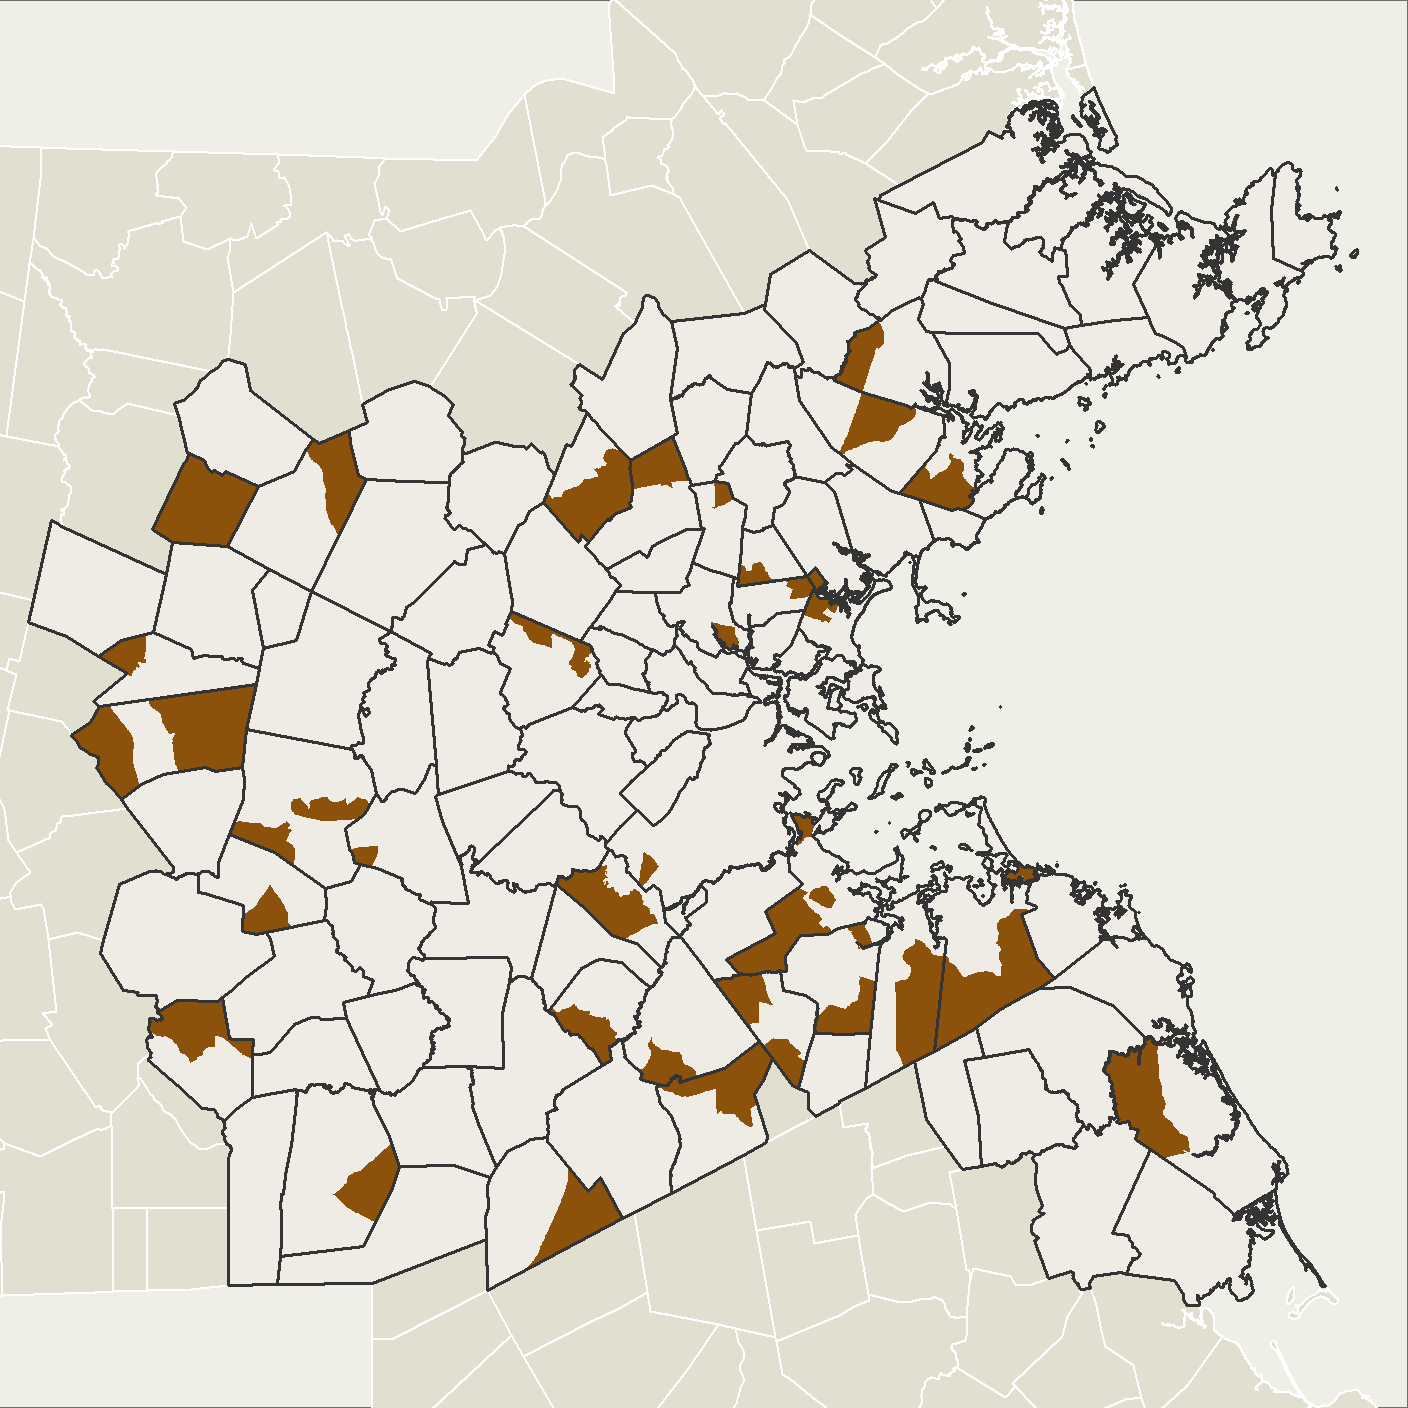
Low-Density Suburban, Mixed Prices
Submarket 6 is comprised of lower density areas around urban centers, and can be seen in municipalities like Salem, Burlington, Marlborough, Dedham, and Weymouth. Compared with other submarkets, housing stock in this submarket is relatively new: most homes were built in 1960 or later. Of all the submarkets, Submarket 6 also has the highest average rate of homes built in 2000 or later. It has also seen the greatest increase in housing density, at an average of close to 30 percent over 2000. Housing stock is a mix of single-family homes and larger multifamily buildings of five or more units, with fewer two-, three-, and four-family buildings than the denser urban submarkets. It has the lowest home prices in the region and among the lowest increase in prices since 2000. Submarket 6 has the highest average rate of foreclosures of the submarkets, and home sales have seen moderate decline since 2000. Compared to other suburban communities, Submarket 6 has a high level of renters, and it’s the only submarket with an increasing share of renters on average since 2000. Despite low home sale prices, average rents in this subregion are third highest among the seven submarkets, and the rents have had the third highest average rate of increase.
Submarket 6 is relatively small, with only nine percent of the regional population. In many ways, Submarket 6 looks like the region overall—eight percent of residents are Black, seven percent Latinx, 11 percent Asian, and 71 percent White. Submarket 6 has seen 15 percent growth in population since 2000, tied for fastest growth with Submarket 1. Unlike Submarket 1, however, all the growth in population has been among populations of color. Black, Latinx, and Asian populations in the submarket grew by 113 percent, 204 percent, and 120 percent, respectively—the fastest growth in any submarket for all three groups—while the White population shrank by two percent.
Immigrants make up about 22 percent of the population in Submarket 6, on par with the region overall. Only three percent of residents are exposed to the language discrimination associated with limited English proficiency.
Households with seniors and those with children make up an average share of households in Submarket 6. Just under 30 percent of all the submarket’s households have children, similar to the regional average, and about ten percent of households with children in the region live in the submarket.
Public school performance in Submarket 6 is average. Its median MCAS scoresTest scores are an incomplete measure of school performance, but they often influence where families seek to locate, if they have the means to choose. fall in the middle (fourth) of the seven submarkets. When it comes to improving student test scores from third to eighth grade, the submarket performs slightly higher, at third best of seven.
Rates of college attainment in Submarket 6 also fall in the middle of the submarkets, at 47 percent, five points below the regional average; but college attainment rates have grown by 27 percent, three points faster than the regional average.
Submarket 6 is the second lowest of all the submarkets in access to public transit. Only four percent of its land area is within half a mile of rapid transit or commuter rail service. Residents in Submarket 6 have access to about 5,000 jobs on average within 45 minutes on transit.
At five percent, the rate of unemployment in Submarket 6 is the same as the regional average.
The rate of severe cost-burdenPaying more than half of household income on housing costs. in Submarket 6 is also the same as the regional average at 16 percent.
Very little—less than ten percent—of the land area in Submarket 6 was assigned a HOLC score in the 1930s, because much of the land was undeveloped or rural.