
Submarket 5
Low-Density Suburban, Highest Prices
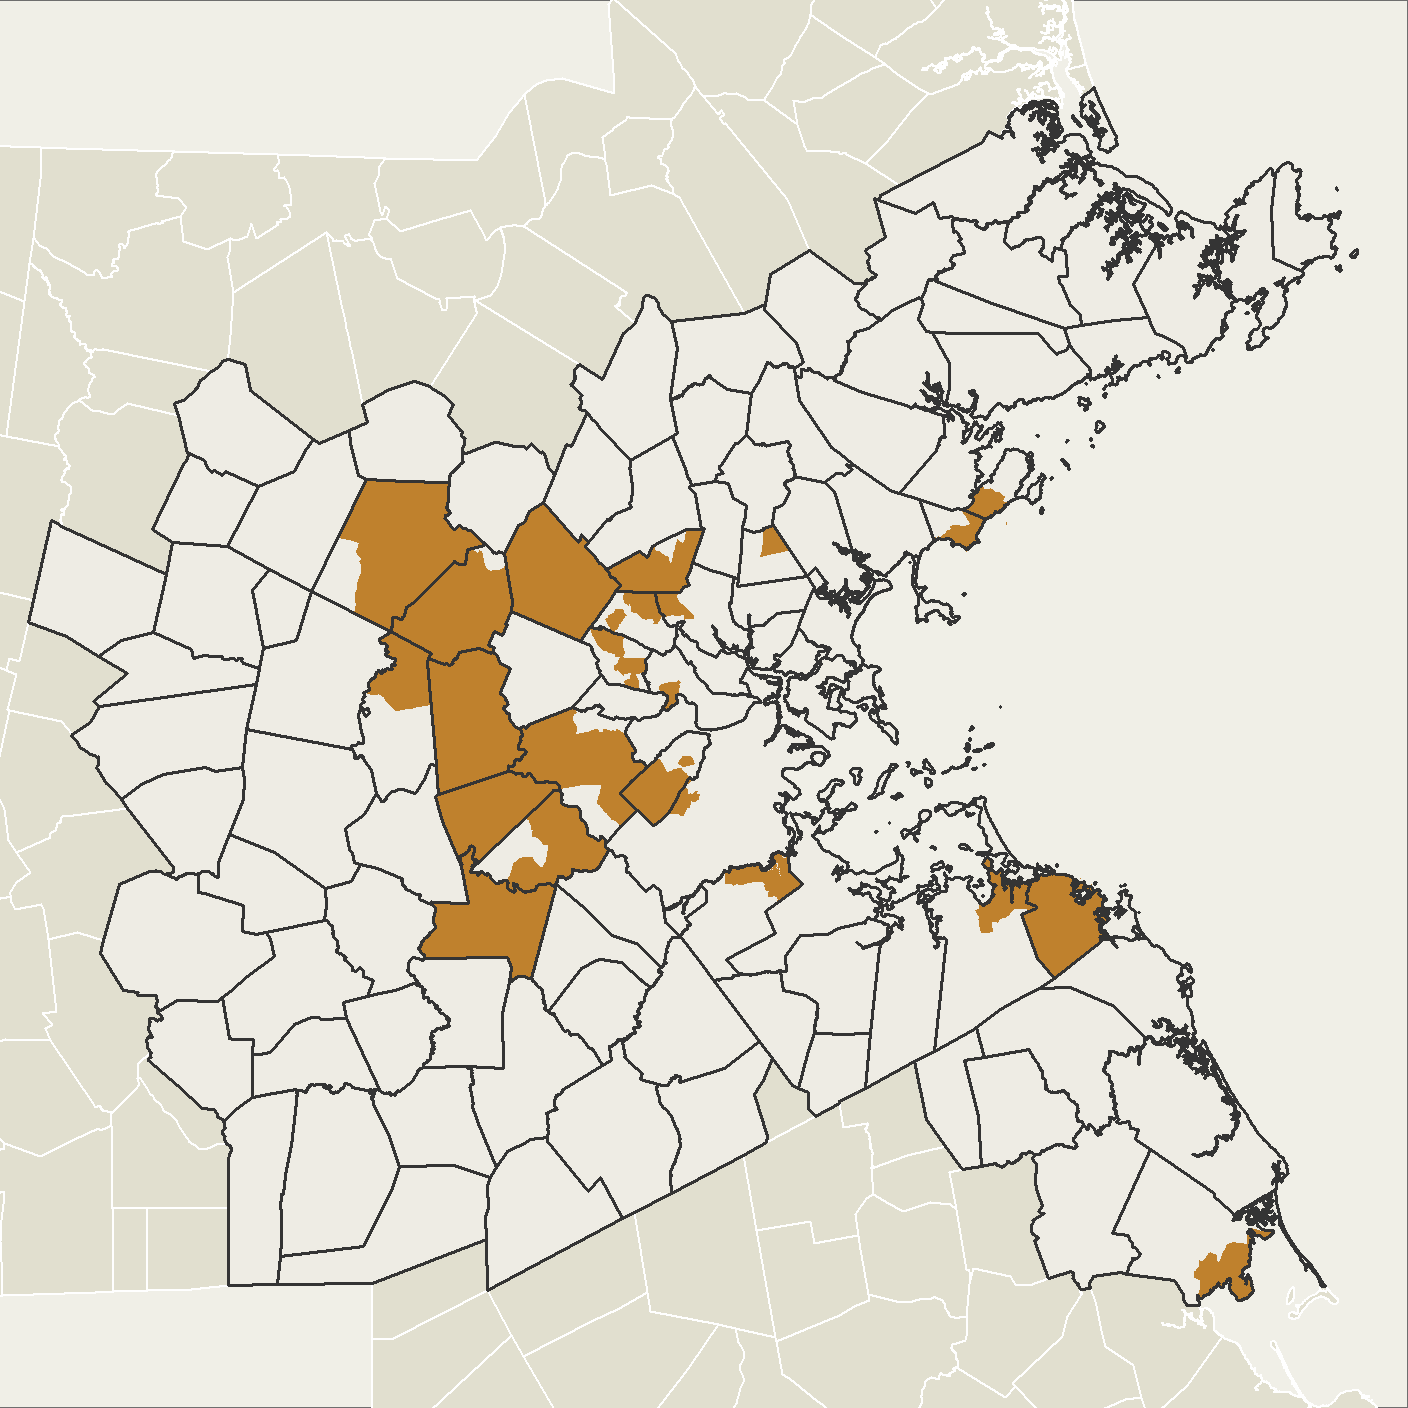
Low-Density Suburban, Highest Prices
Submarket 5 is the most affluent submarket in the region, and with average home prices approaching $1 million, it has some of the region’s most expensive homes. Submarket 5 areas can be found in wealthy suburbs such as Lincoln, Weston, and Dover, as well as in old, established streetcar suburbs like Newton and Brookline. The housing stock is old and large. Most homes were built before 1960, and most are single-family homes with three or more bedrooms. Though homes are expensive, prices have increased only moderately since 2000 compared to other submarkets. Despite this submarket’s premium prices, its volume of sales has increased on average, while in all but one other submarket, sales have, on average, declined –sometimes steeply. Less than 20 percent of households rent their home, and rents in the submarket are second highest only to Submarket 1. Submarket 5 saw the largest decline in renter households of the seven submarkets since 2000.
Submarket 5 is home to nine percent of the region, a relatively small share compared to other submarkets. It also has the smallest share of Black and Latinx residents of all the submarkets—only two percent are Black and three percent are Latinx, compared to nine percent and 11 percent, respectively, regionwide. Conversely, it has a larger share of Asian and White residents—12 percent Asian residents and 79 percent White residents, compared to nine percent and 68 percent regionwide. Despite the low numbers, Black and Latinx populations have grown in Submarket 5 since 2000—the Black population grew 45 percent and the Latinx population grew 135 percent. In total numbers, this represents only about 2,000 and 7,000 people, respectively. By comparison, the Asian population grew by 18,000 people, or 107 percent, over 2000. The White population declined at six percent (16,000 people), about the same pace as the region overall.
Immigrants make up only 17 percent of the residents in Submarket 5, and those with limited English proficiency only two percent, both below the regional averages of 21 and five percent, respectively. For those residents who are English language learners—about 5,000 people—representing such a small share of the population may be especially isolated and exposed to language discrimination.
Submarket 5 has a relatively large share of households with members ages 65 or older—35 percent compared to 29 percent in the region overall. Because of its small population, however, that represents just ten percent of households with seniors in the region.
Submarket 5 has the largest share of households with children of all the submarkets at 39 percent, ten points higher than the region overall. It also has an outsized share of households with children compared to its size. However, because it is a relatively small submarket, the total number of households with children is just under 42,000, or only 11 percent of all households with children in the region.
It is no wonder that Submarket 5 has a high share of households with children, because it has the best public-school performance of the seven submarkets. MCAS scoresTest scores are an incomplete measure of school performance, but they often influence where families seek to locate, if they have the means to choose. for both the Mathematics and English Language Arts (ELA) tests are the highest of any submarket, as are the measures of student improvement from third to eighth grade. Yet only a small share of the region’s children—and an even smaller share of the region’s Black and Latinx children—have access to these high-performing school systems.
It is no wonder that the rate of college attainment is highest in Submarket 7, at 79 percent—27 points higher than the regional average.
Because of its inclusion of parts of streetcar suburbs, Submarket 5 has the most access to public transit of the mostly-suburban submarkets, with 13 percent of its land area lying within half a mile of rapid transit or commuter rail service. Residents of Submarket 5 have access to about 10,000 jobs on average—also higher than any of the other suburban-dominated submarkets.
Workers in Submarket 5 have the lowest rate of unemployment of the submarkets, at 3.7 percent.
Despite the high home prices in Submarket 5, the rate of severe cost-burdenPaying more than half of household income on housing costs. is low (13 percent) compared to the region overall (16 percent).
The rate of home mortgage loan denials for high-income applicantsDefined here as applicants with combined incomes of $125,000 or more. in Submarket 5 is the lowest of all the submarkets, at eight percent, two points below the regional average. High-income White, Asian, and Latinx applicants all have denial rates at or close to eight percent (nine percent for Latinx). At 19 percent, however, denial rates for high-income Black residents are more than double.
The legacy of redlining is as strong in Submarket 5 as in Submarket 2—but in the opposite direction. Most of the inhabited land area of Submarket 5 was given a HOLC score of “A” or “B.” Though much of the land area of Submarket 5 was not graded back in the 1930s because of low population density at the time (about 70 percent was not graded), of the areas in the region that were assigned a HOLC score, Submarket 5 made up 83 percent of those graded “A.” It also covered half of all areas graded “B.” To learn more about redlining and its impacts, see Mapping Inequality.