
Submarket 4
Low-Density Urban-Suburban Mix, Lower Prices
Low-Density Urban-Suburban Mix, Lower Prices
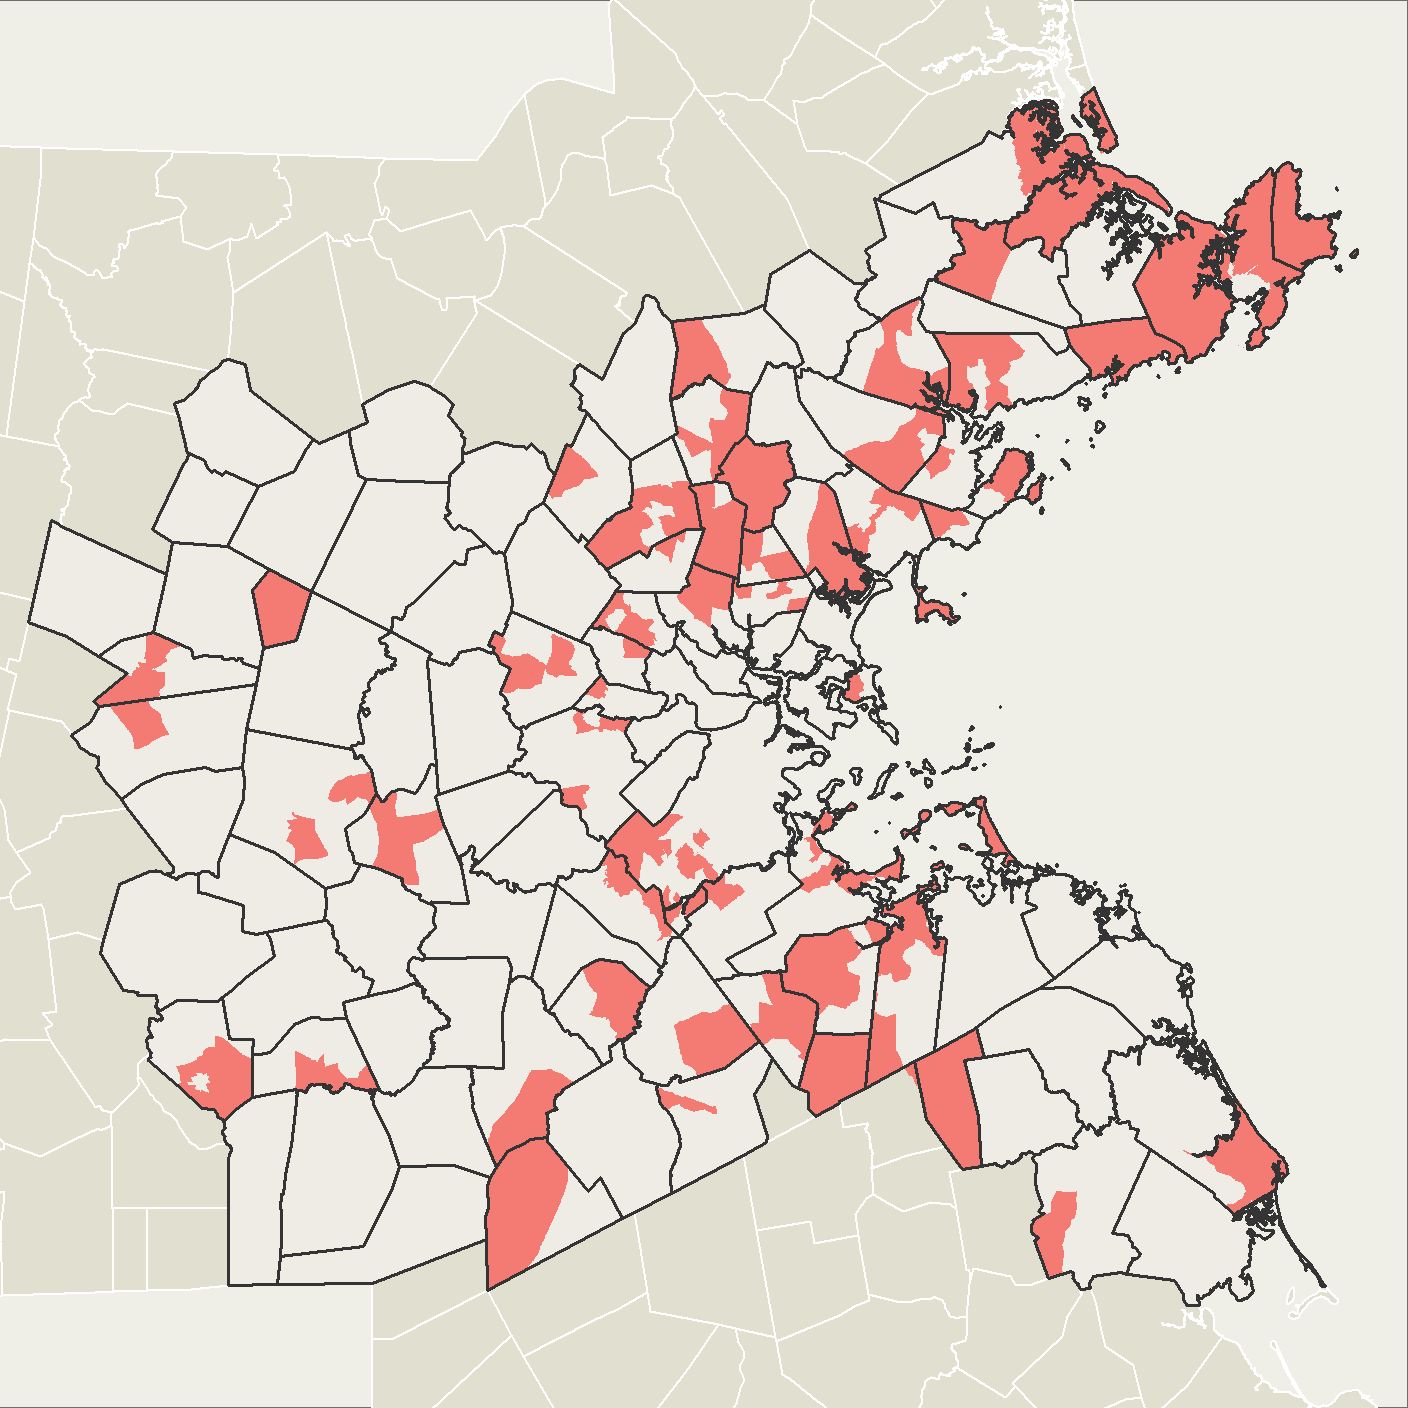
Submarket 4 areas are found in the region’s suburbs and regional urban centers, but also in the Boston neighborhoods of West Roxbury, Roslindale, and Hyde Park. The housing stock is generally older, low density, and made up mostly of single-family homes with three or more bedrooms. Home prices are moderate, and residents of Submarket 4 are a mix of moderate-low and moderate-high income, with a median income in the middle of the seven submarkets. This submarket is predominantly owner-occupied, and it has an above average foreclosure rate. Only about a third of households rent their home, though rental prices are among the lowest of the submarkets, and rents have seen the lowest increase of any of the submarkets. The share of renter units in Submarket 4 has declined since 2000.
Submarket 4, the second largest by population after Submarket 3, is home to 22 percent of the region’s residents. At 79 percent, the White share of residents in Submarket 4 is more than ten points higher than the regional average of 68 percent. Latinx and Asian residents make up only six percent each of the population, and Black residents seven percent, all underrepresented compared to the region overall. Populations of color have seen significant growth in Submarket 4, however—since 2000, the Black population has grown 78 percent, the Asian population 84 percent, and the Latinx population 168 percent. The White population has declined eight percent.
Immigrants represent only 15 percent of Submarket 4’s population, but that’s more than 100,000 people. Only three percent of the population in Submarket 4 has limited English proficiency (which exposes them to language discrimination), but those more than 40,000 people represent 12 percent of English language learners in the region.
A third of households in Submarket 4 have a household member aged 65 or older, more than the regional average by five points, and a quarter of all households with a member 65 or older—91,000 households—live in the submarket.
The share of households with children is smaller, at 29 percent, and on par with the regional average; but again because submarket is populous, this translates to just over 80,000 households with children.
Public school performance in Submarket 4, as measured by MCAS scoresTest scores are an incomplete measure of school performance, but they often influence where families seek to locate, if they have the means to choose. is slightly better than average—with the third highest median score in both the Mathematics and English Language Arts (ELA) tests. In performance as measured by score improvement between third and eighth grade, however, the submarket falls to the middle with the fourth highest median growth score.
Adults in Submarket 4 are less likely to have a college degree than adults in the region overall, with a rate of 46 percent compared to the region’s 52 percent average. Growth in the rate of college degree attainment also falls just short of the regional average, at 22 percent compared to 24 percent.
Public transit in Submarket 4 is significantly more limited than in the denser submarkets, with only six percent of its land area located within half a mile of a rapid transit or commuter rail station. This means access via transit to fewer jobs—about 8,000—on average within 45 minutes. Still, unemployment is average for the region in Submarket 4, at 4.8 percent.
Households in Submarket 4 have a rate of severe cost-burdenPaying more than half of household income on housing costs. (14 percent) that is just below the regional average (16 percent).