
Submarket 3
Moderate-Density Urban, Moderate Prices
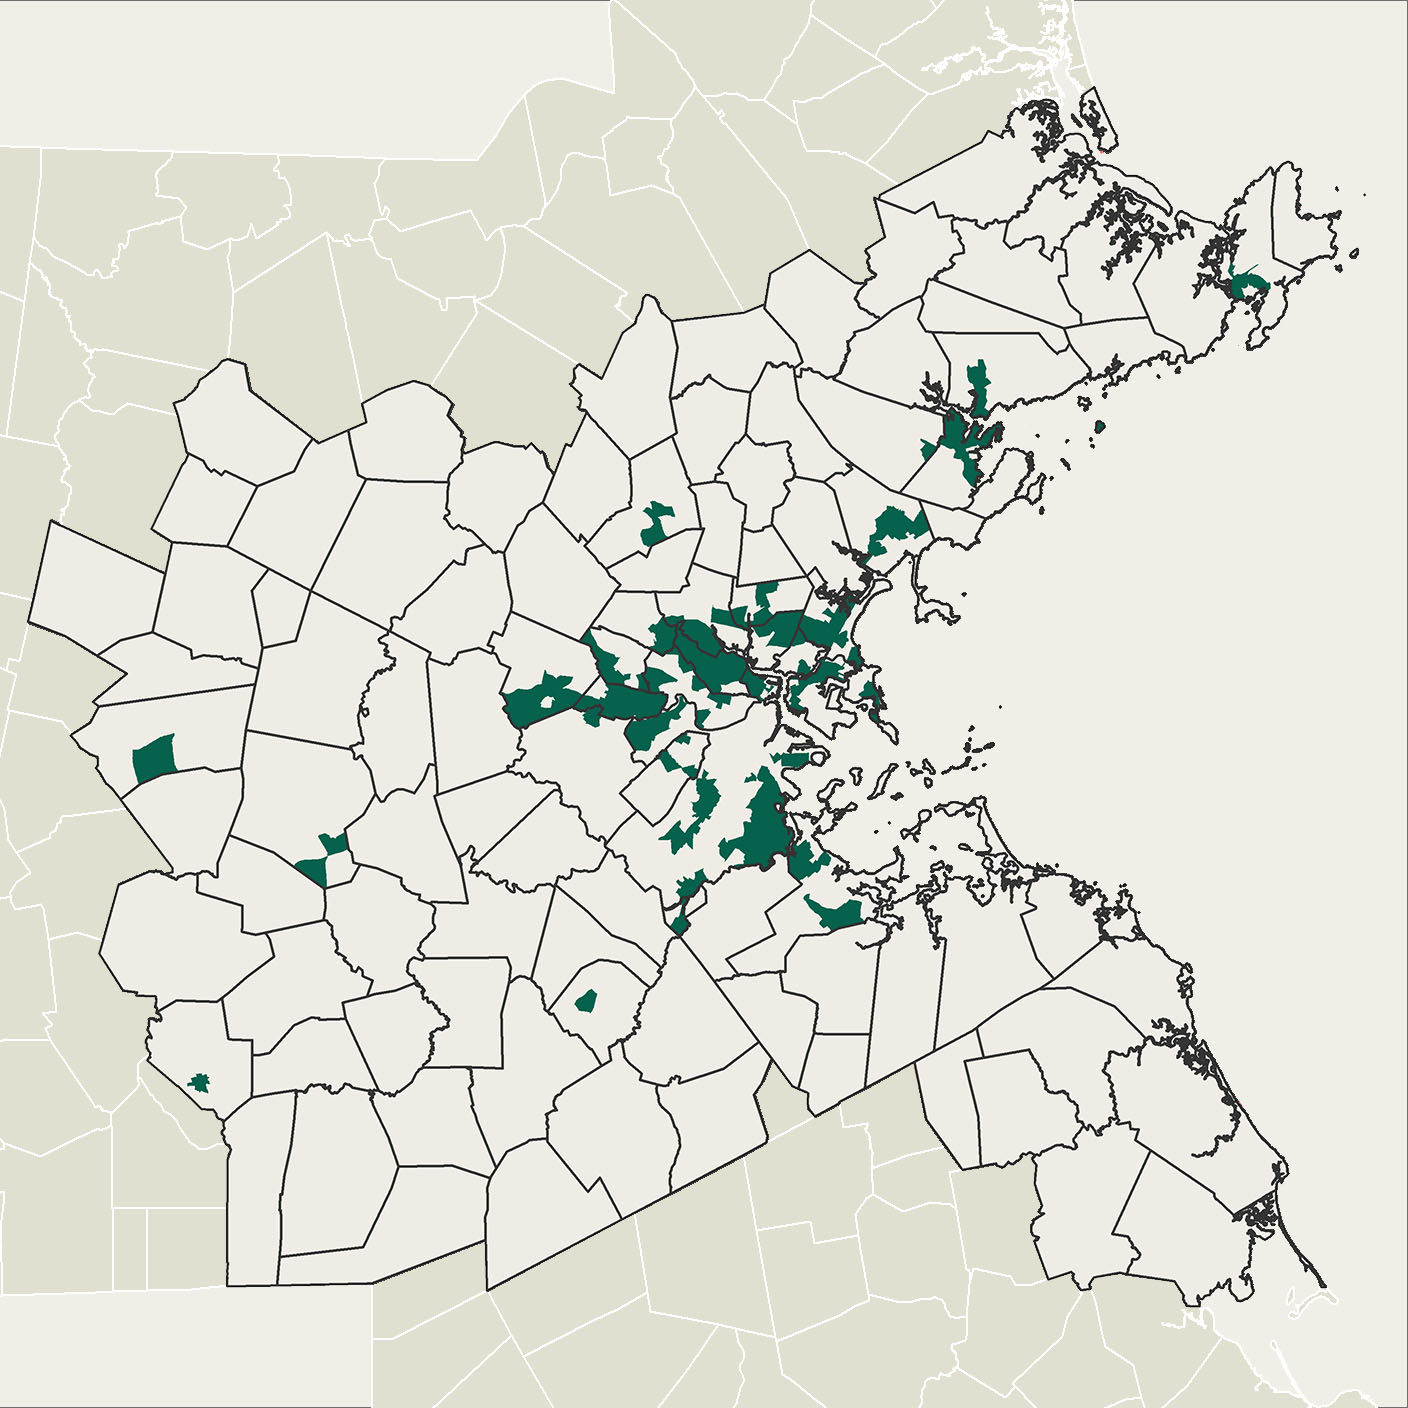
Moderate-Density Urban, Moderate Prices
Submarket 3 occurs in moderate-density urban communities like Dorchester, Somerville, Lynn, and Waltham. Housing stock in this submarket is dominated by smaller multifamily homes, including the region’s iconic triple-deckers. It also has the region’s oldest housing stock—on average, three out of every four housing units in Submarket 3 were built in or before 1959. Home prices and rents are average for the region, but both have seen above average increases since 2000. Households are mostly low-to-moderate income, and as in Submarket 1, renters make up most of the residents – although the share of renters has declined over the last twenty years. Foreclosures are an issue in Submarket 2, but they occur at a moderate rate, as do business buyer sales, and cash sales.
Submarket 3 has the largest population share of the submarkets—24 percent of the region lives in Submarket 3. It is a racially and ethnically diverse submarket, and it’s home to 35 percent of the region’s Black residents, 41 percent of Latinx residents, 27 percent of Asian residents, and 19 percent of White residents. Since 2000, Submarket 3 has had a modest increase in Black residents (13 percent), and more rapid increases in Latinx (84 percent) and Asian (52 percent) residents, and the largest decline in White residents (-12 percent) of the submarkets.
About 240,000 Submarket 3 residents—almost a third of the submarket’s population—are immigrants. This is more than any other submarket. A full 45 percent of the region’s residents whose limited English proficiency exposes them to language discrimination live in Submarket 3.
The submarket’s share of households with children is 27 percent, just below the regional average of 29 percent. However, because of the submarket’s size, that’s more than 81,000 households, the second most households with children of the submarkets after Submarket 7.
Public school performance, however, is low. Of all the submarkets, Submarket 3 has the second lowest MCAS scoresTest scores are an incomplete measure of school performance, but they often influence where families seek to locate, if they have the means to choose. and measures of student score-improvement from third to eighth grade.
Rates of college attainment or higher in Submarket 3, at 46 percent, are lower than the regional average, but the rate of college attainment in the submarket grew by a third over the last decade.
Submarket 3 is relatively well-served by public transit, with 40 percent of land area located within half a mile of a rapid transit station. Using transit, residents have access to 50,000 jobs on average. Unemployment is average, at 5.1 percent.
The rate of severe housing cost burdenPaying more than half of household income on housing costs. Submarket 3 is slightly higher than the regional average, 18 percent compared to 16 percent, but because of its large population share, it is home to more than a quarter of the region’s severely cost-burdened households.
Home mortgage loan denial rates for high-income applicantsDefined here as applicants with combined incomes of $125,000 or more. in Submarket 3 are average at ten percent. Denial rates for Black, Latinx, and Indigenous mortgage loan applicants are higher than the submarket average, at 21 percent, 17 percent, and 14 percent, respectively, but those rates are average for each race in the region overall.