
Submarket 2
High-Density Urban, Lower Prices
High-Density Urban, Lower Prices
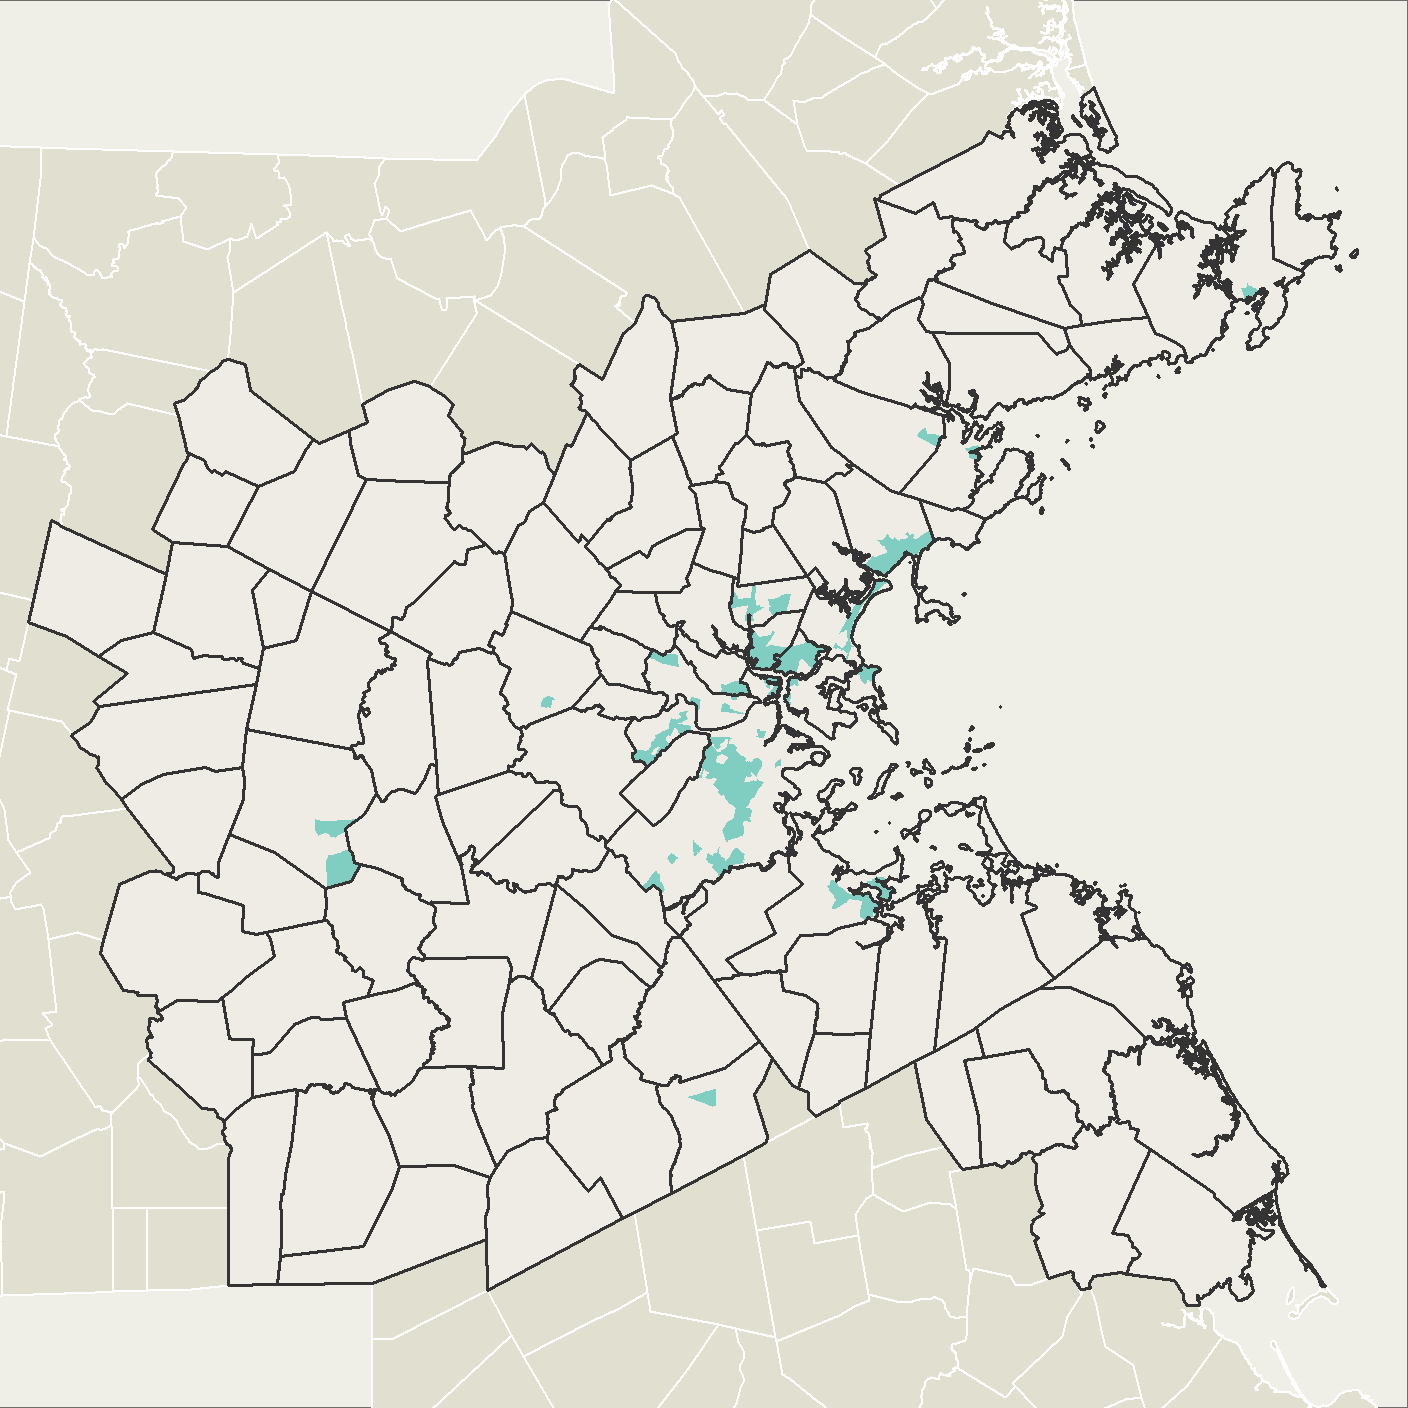
In Submarket 2, home prices and rents are relatively low. Density is the second highest in the region and getting higher. Submarket 2 areas are primarily concentrated in the region’s inner core, as well as in regional urban centers such as Framingham, Quincy, Peabody, and Gloucester. This submarket has the highest share of renters of all submarkets, and roughly a tenth of its housing units are HUD subsidized, more than any other submarket. Submarket 2 also has high levels of foreclosure activity and the highest share of business buyer sales, with a rate of cash sales second only to Submarket 1. Despite its low costs, Submarket 2 has experienced the second greatest increase in home sale prices over the last two decades, after Submarket 1.
Submarket 2 is home to just over a tenth of the region’s population. Nearly two-thirds of these 360,000 residents are Black, Latinx, Asian, Indigenous, or multiracial. Thirty percent of the region’s Black residents, and 27 percent of its Latinx residents live in Submarket 2. The submarket’s population has grown 12 percent since 2000, faster than the region’s average of eight percent. Most of that growth can be attributed to Latinx and Asian populations, which grew 59 and 41 percent, respectively. The Black population grew just one percent, and the White population declined nine percent.
The submarket’s 127,000 immigrants make up 35 percent of its population—a share greater than any other submarket. Submarket 2 also has the region’s and highest rate of residents whose limited English proficiency exposes them to language discrimination. Just over a quarter of the region’s English language learners live in Submarket 2.
Submarket 2 has a slightly smaller share of households with adults 65 years or older (24 percent) than the region overall (28 percent). Households with children make up 27 percent of households in Submarket 2, on par with the region overall.
The submarket’s public schools have some of the region’s lowest median MCAS scoresTest scores are an incomplete measure of school performance, but they often influence where families seek to locate, if they have the means to choose. of the seven submarkets (tied for lowest with Submarket 1). They also perform worst at improving students’ MCAS scores between third and eighth grades.
In contrast to Submarket 1, however, adults in Submarket 2 have the lowest rate of college educational attainment of the seven submarkets, at 33 percent. The submarket has seen the highest growth in adults with a college degree, a 34 percent increase—ten points higher than growth in the region overall.
Half of Submarket 2 land area is within half a mile of rapid transit or commuter rail service, and the central location affords residents access to tens of thousands of jobs within 45 minutes on transit. Despite this, workers in Submarket 2 have the highest rate of unemployment of the submarkets by a margin of more than three points. The unemployment rate in Submarket 2 at 8.3 percent is more than double that of Submarket 5, at 3.7 percent.
Of the seven submarkets, households in Submarket 2 are the most likely to be severely housing cost-burdenedPaying more than half of household income on housing costs. —a quarter of households pay more than half their income on housing costs.
Home mortgage loan denial rates for high-income applicantsDefined here as applicants with combined incomes of $125,000 or more. are highest in Submarket 2, at 18 percent. Mortgage loan denial rates for high-income Black, and Latinx residents in Submarket 2 are higher than the average for the submarket, at 31 percent and 22 percent, respectively. By contrast, denial rates for high-income White and Asian residents in Submarket 2 are each 14 percent.
The challenges facing Submarket 2 are no accident. Redlining affected the areas that make up Submarket 2 like no others. A quarter of the submarket’s land area was redlined—given a HOLC score of “D,”—the highest share for any submarket. Another third of the land was graded “C,” and none was graded “A.” For more details on redlining and its impacts, see Mapping Inequality.