
Submarket 1
High-Density Urban, High Prices
High-Density Urban, High Prices
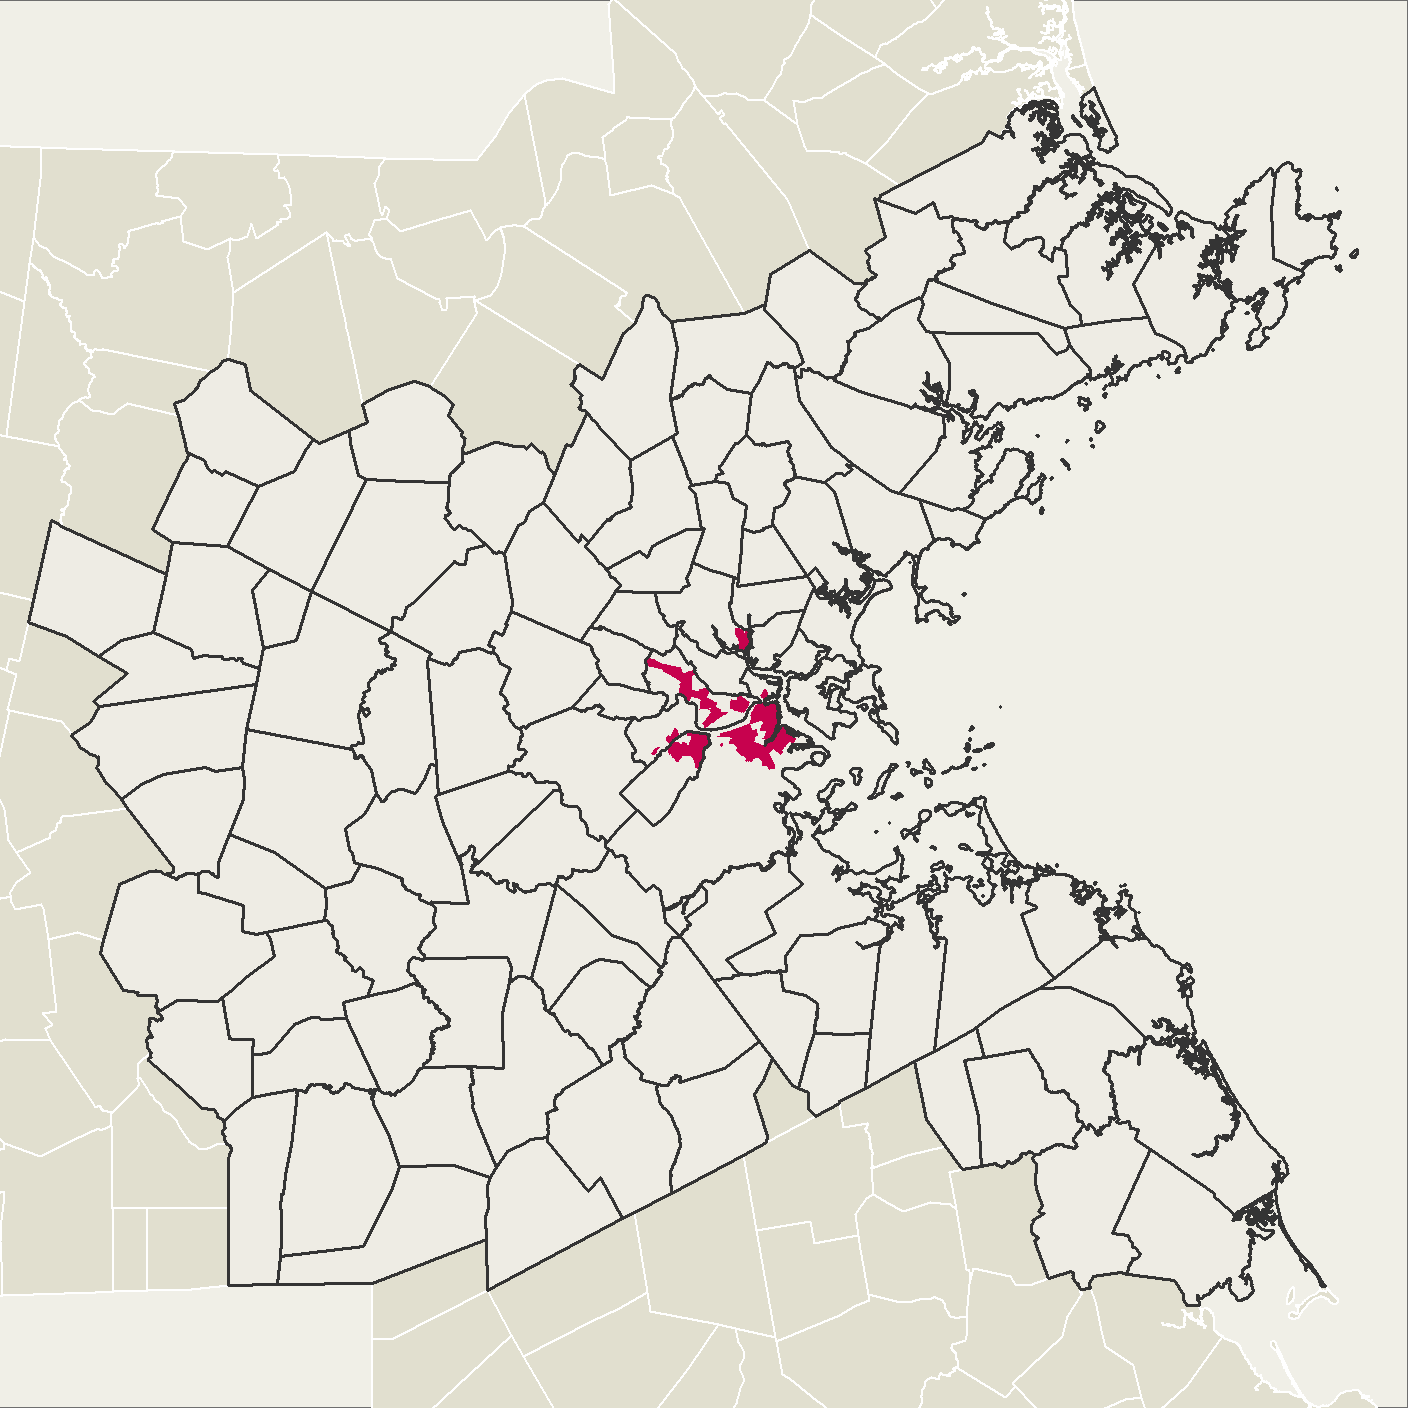
Submarket 1 is comprised of dense urban communities with high-priced housing. Boston, Cambridge, Brookline, and Medford all have Submarket 1 areas. This submarket’s housing stock is generally older, with most structures built before 1959. It’s also the highest-density submarket in the region: roughly 70% of its housing buildings have five or more units. Nearly two thirds of this submarket’s housing stock is comprised of rental units, although that proportion is dropping. Rents are the highest in the region, and home prices are second only to those in Subregion 5’s affluent suburbs. Submarket 1 has low foreclosure activity, many business buyers, and many cash sales. Over the past two decades, this submarket has seen the second greatest increase in housing density of any in the region.
Submarket 1 is home to just six percent of Greater Boston’s population. At roughly 200,000 people, it is the smallest submarket by population, but that population has grown by 15 percent since 2000—more than any other submarket. The racial and ethnic diversity of Submarket 1 is similar to the region overall, though its White population is larger and its Black and Latinx populations are smaller than the other dense, urban submarkets. Subregion 1 is the only urban submarket to gain White population since 2000, and the only one to lose Black population. While the Black population in Greater Boston overall increased 21 percent, the Black population in Submarket 1 declined 11 percent; and while the White population in the region overall declined by five percent, in Submarket 1 it increased eight percent.
Compared to other submarkets and to the region overall, Subregion 1 has fewer households with children and fewer with adults aged 65 or older. It has only three percent of the region’s households with children and five percent of its households with older adults, despite having eight percent of all of households.
Although it’s home to some high-performing public schools, on average, Submarket 1 is tied with Submarket 2 for lowest public school performanceTest scores are an incomplete measure of school performance, but they often influence where families seek to locate, if they have the means to choose.. Median scores in both the Mathematics and English Language Arts (ELA) MCAS tests are lowest in Submarkets 1 and 2, as is score improvement from third grade to eighth grade in both tests.
Despite low-performing public schools, Submarket 1 adults are much more likely than adults in any but one other submarket to be college educated or have a master’s degree or PhD. Nearly 80 percent of adults in Submarket 1 and Submarket 5 have a higher-education degree, compared to the region’s average of 52 percent.
As a submarket situated entirely within the dense core of the region, Submarket 1 is well serviced by public transit—almost 90 percent of its land is within half a mile of a rapid transit or commuter rail station—which offers easy access for its residents to hundreds of thousands of jobs. Unemployment is just below the regional average.
Despite low unemployment, and perhaps due to the high cost of housing, the rate of severe housing cost burdenPaying more than half of household income on housing costs. in Submarket 1 is 19 percent, slightly higher than the regional average of 16 percent.
In the 1930s, about a fifth of the land area of Submarket 1 was redlined—that is, it was deemed too risky for mortgage lenders and financial investment by the federal Home Owners Loan Corporation (HOLC) agency. The agency assigned a grade of “D” to 20 percent of what is now Submarket 1, and a grade of “C” to another 36 percent. Thirteen percent of land area in the subregion was graded “B” and none was graded “A.” For more details on redlining and its impact, see Mapping Inequality.