
Submarket 7
Low-Density Suburban, Moderate Prices
Low-Density Suburban, Moderate Prices
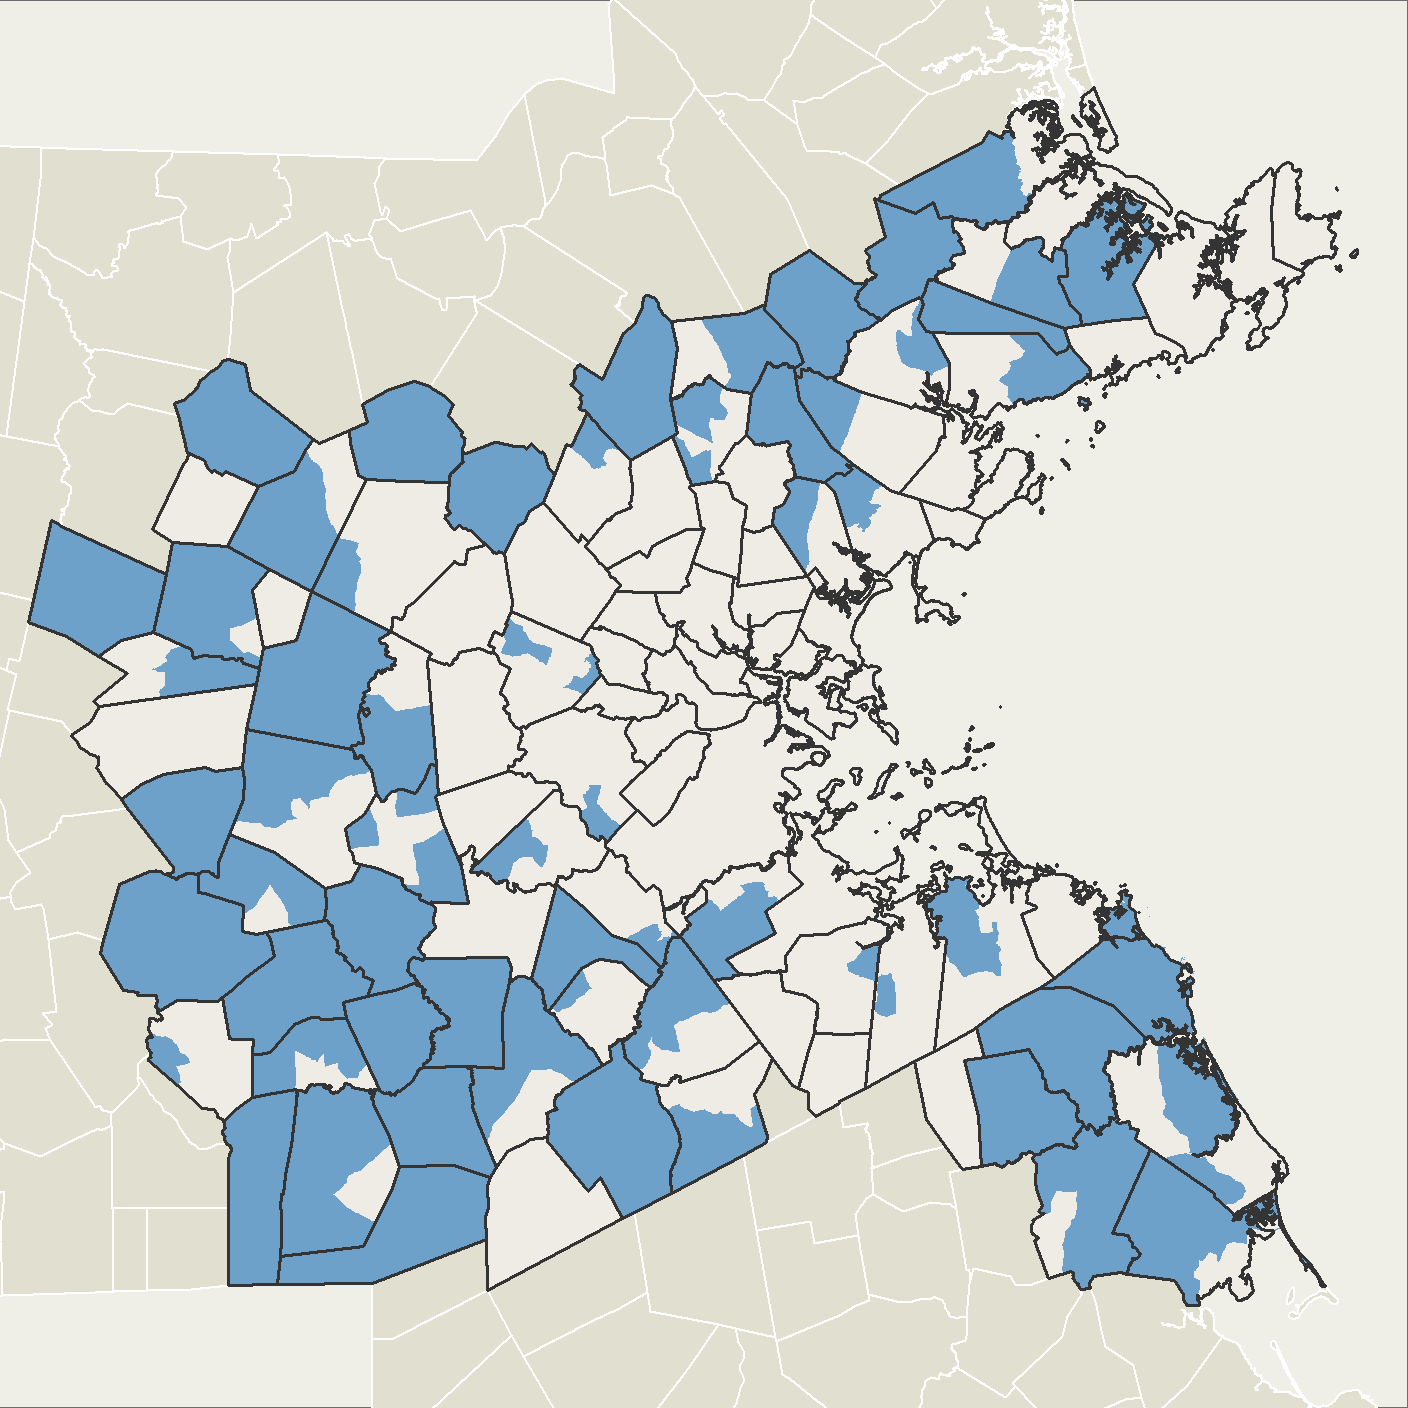
Submarket 7 is the lowest-density submarket, and is comprised of mostly single-family homes. Submarket 7 areas form a semi-circle around the region in municipalities such as Topsfield, Sudbury, Sharon, and Norwell. Home prices are moderate, but residents of the region are relatively wealthy, with the second-highest average incomes after Submarket 5. Most residents of Subregion 7 own their homes. Although there are few rental opportunities, rental prices are relatively low for the region. The volume of home sales in this submarket has grown faster than most of the region, however sale prices have increased the least of the seven submarkets. With stable moderately-priced housing options, it is perhaps not surprising that Submarket 7 has the lowest housing unit vacancy rate of the submarkets.
Submarket 7 is the third largest submarket by population, after Submarkets 3 and 4, and is home to 19 percent of people in the region. It is the Whitest of the submarkets, with White residents representing a full 87 percent of the population, nearly 20 points higher than the region overall. Black, Latinx, and Asian residents make up only two percent, three percent, and six percent of residents in the submarket all well below their share regionwide (at nine, 11, and nine percent, respectively). Despite their small share of the population, populations of color—especially Latinx and Asian populations—have been growing in the submarket since 2000. The numbers of Asian residents grew by 154 percent and Latinx residents by 139 percent. The Black population grew by 57 percent The White population grew by one percent in the submarket—slow growth, but growth, compared to their five percent decline in the region overall. Overall population growth in Submarket 7 has been average, at eight percent.
Immigrants are underrepresented in Submarket 7 as compared to the region overall—11 percent of people in the submarket were born in another country, ten points lower than in the region overall, and the smallest share of all the submarkets. Only one percent of residents have the limited English proficiency associated with language discrimination.
Older adults are more likely to live in Submarket 7 than the region overall—32 percent of households have a member aged 65 years or older, four points higher than the region. Because of its large population share, that is more than 72,000 households, the second highest in number after Submarket 4.
A lot of children live in Submarket 7, too. More households with children are located in Submarket 7 than in any other submarket: 81,600, or 36 percent of all of the submarket’s households.
MCAS test scoresTest scores are an incomplete measure of school performance, but they often influence where families seek to locate, if they have the means to choose. in Submarket 7 are the second highest of the submarkets, after Submarket 5, as are the measures of student test score improvement.
At 59 percent, the rate of college-degree attainment in Submarket 7 is above the regional average by seven points, and it’s third highest in the region. Still, it trails behind Submarkets 1 and 5 by twenty points. Growth in college attainment has been just below the regional average, at 20 percent (compared to 24 percent).
As the lowest-density submarket and the farthest from the core of the region, it is not surprising that Submarket 7 has the lowest access to public transit—just three percent of its land area is within half a mile of a rapid transit or commuter rail station. Given this, access to jobs via transit is lowest in the submarket, as well.
Despite the low transit access to jobs, unemployment in Submarket 7 is only 4.1 percent, which is below the regional average and the second lowest in the region after Submarket 5.
Given the low cost of housing and the relative wealth of residents in Submarket 7, its rate of severe cost-burdenPaying more than half of household income on housing costs. in the submarket is lowest of the seven submarkets at 11 percent—five points lower than the regional average.
At ten percent, Submarket 7’s home mortgage loan denial rates for high-income applicantsDefined here as applicants with incomes of $125,000 or more. is average for the region at 10 percent. Denial rates for high-income Black, Latinx, and Indigenous applicants are all higher: 18 percent, 15 percent, and 13 percent, respectively. For high-income Black applicants, however, a denial rate of 18 percent is the lowest of any of the seven submarkets. For high-income Latinx applicants, it is second lowest, after Submarket 5, and for high-income Indigenous applicants, it is third lowest after Submarkets 5 and 6. Still, the contrast with Asian and White high-income applicants is stark, at rates of eight and nine percent, respectively.
Redlining didn’t have an obvious impact on Submarket 7 because in the 1930s not many people lived in the areas that far outside of the core of the region. Almost none of the land area in the submarket was assigned a HOLC grade. To learn more about redlining and its impacts, see Mapping Inequality.